| Contents | 1 | 2 | 3 | 4 | 5 | 6 | 7 | 8 | 9 | 10 | 11 | 12 | 13 | 14 | 15 | 16 | 17 | 18 | 19 | 20 | 21 | 22 | Previous | Next |
| 6. CROME Main Screen |
|
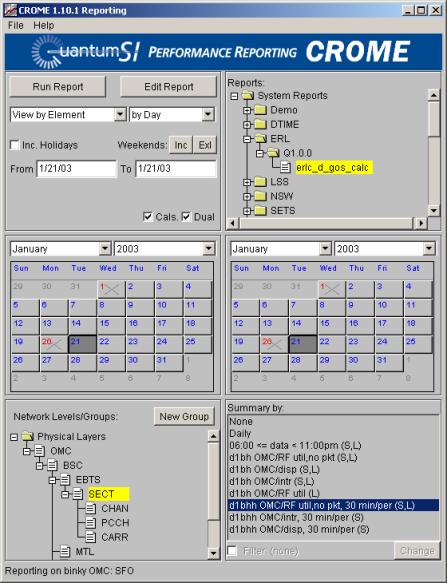
Once the initialization is complete, the CROME Main Screen will appear. The primary function of the main screen is to run reports, but also from this location you can launch the various editors to create reports, formulas, and groups, as well as providing all other CROME functions. Pictured below is the CROME
main screen. The screen is a grid of
six elements, all of which are used to specify the parameters to apply and run
a report. Keep in mind that in CROME
all reports are generic and can be applied to any time focus (i.e. fifteen
minute, half hour, daily, weekly, monthly and arbitrary) and to any compatible
network level. For example, if you can
apply a report to the Sector level of your network topology, that same report
will work at a SITE level, BSC level and even a national roll-up. This concept and technique of supporting
generic report definitions allows one CROME reports to typically fill the roll
of a dozen reports in competing performance management (PM) systems. A typical screen for a Motorola OMC system
is shown below:
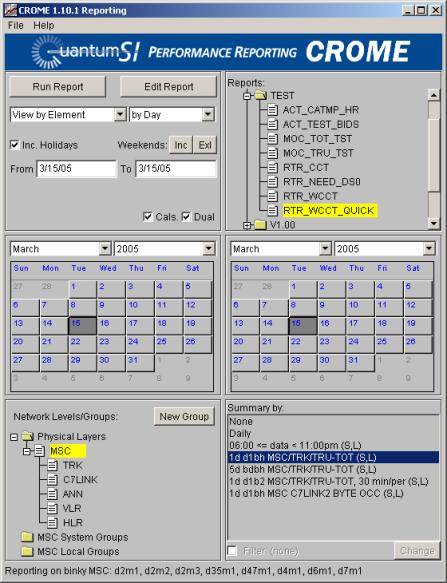
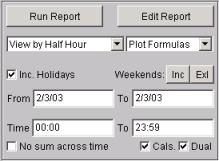
The top-left portion of the CROME Main Screen provides some of the basic filtering: “View by” for time granularity or to choose to view by element, the date and optional time range for the report, choices for including/excluding weekends and holidays from the report, and buttons to run the report and modify the report. The upper-right section is where you choose the report to run. The middle section of the screen contain “Calendar pickers” to assist in the quick selection of the date ranges for the report. The bottom-left portion is where you select the physical level for the report, or the user-defined grouping. Finally, the bottom-right section is where you select the data ”roll-up” you want to view (e.g., raw data, data rolled up and summed by day, data summed for only a certain portion of the data, or data rolled-up by a known bouncing-busy-hour formula). We will review the “Main” screen in this section, but will go into detail in later sections discussing Running and Editing Reports, Creating New Reports, Network Level Groups and Creating New Formulas. There are several variations to the display depending upon what system type you are analyzing. For example a typical screen for a Nortel MSC switch is shown below (note each system has a different set of reports/groups/formulas and also a different physical hierarchy):
In addition you might see a "Message of the Day" pop-up upon the initial application or applet startup. This window contains late breaking news on updates and system issues to CROME users.
Once you have read it simply quit this window (hit the [X] in the upper right) to remove it from your desktop workspace. You may restore this message pop-up at any time via the menu selection "Help/Message of the Day" |
| View By | Top |
|
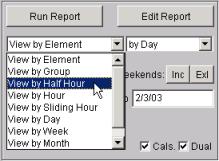
“View By” controls the period of granularity in the time dimension and determines the “x-axis” on the graph presentations. The lowest certain available time granularity is “View By Hour”, but many systems store their information in finer granularity, in which case “View by Half Hour” or “View by Fifteen Minutes” will also be available. When viewing by Hour or below, you must choose “Summary None” in the Summary section (See “Summary By” below), because all rolled-up summaries are done on a “day” basis. When viewing by day, week, month, or year, you must run on rolled-up summed data. Each “View by” time choice determines the x-axis of the graph (e.g., if you choose a View By Day report and select dates July 1 through July 7, you will have seven x-axis points: July 1 through July 7; if you do the same report view-by-hour, you will get 24x7 or 168 x-axis points). The “View by Element” is different from the other choices, in that the network element becomes the x-axis (e.g., if you are viewing a report for all BSCs, you will have one x-axis point for each BSC in the report. When you choose View By Element, you get an additional pull-down choice: “by Day, Week or Month”. This selection does not affect the report, but it does assist in the selection of dates from the Calendar Pickers (see Calendar Pickers below).
Using "View by 15 Minute", “View by Half Hour” or "View by Hour" will always result in the display of "Time" selection fields in the bottom portion of the box below. This is so that you can exclude certain time periods in the day from your report. If you choose View By Element and you choose “None” in the “Summary By” section (see below), then you get an additional checkbox which says “Do not sum across time”. This checkbox is always preset to unchecked, because it is rarely used. In nearly all cases, a View By Element report returns values summed for each element across the time period. If “Do not sum across time” is checked, then the report will return rows of information separated not only by element but also by each time-interval that the element reported. E.g., a normal “summed across time” report would show something like “BSC1’s value, BSC2’s value”, whereas a “do not sum across time” report would show “BSC1 at time X’s value, BSC1 at time Y’s value, BSC1 at time Z’s value, then BSC2 at time X’s value,” etc.
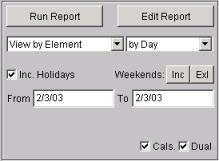
You have the option to include or exclude Holiday or
Weekends data via the For Example you can click on the "Sun", "Mon", and "Tue" text to exclude thoses first three days on the calendars. Any reporting done would be based upon the data in the remaining non-X'd days (left picture). You might also make a "Fridays Only Report" (right picture).
It should become apparent that the If you exclude weekends, holidays or specific days on a view-by-element (or group) report, you will still have the same number of items on the x-axis (the elements of the report). But if you view-by-day or below, you have the option of having CROME either skip the holiday/weekend, or having the report show “empty” values (i.e., no Y value) for the missing days. To include the weekend/holiday on the report with no Y value, check the “Display Excluded Days (as blank)”. The From/To choice is where you enter the date range for the report. The format is MM/DD/YY or MM/DD/YYYY. If you choose a two-digit year, it is Y2K compliant (00-37 means 2000-2037). Instead of typing the date by hand, you’ll find it easier to select the data from the Calendar pickers (see section of Calendar Pickers below). The dates are assumed to be inclusive (for example, a July report is 7/1/98 to 7/31/98, not 7/1/98 to 8/1/98). If you chose to run this report as View by Hour, View by ½ hour, View by fifteen minutes (or View by Element with "Summary By" None), you will see a “Time” from/to box, similar to the Date from/to box. You can enter the time granularity for the report, in a HH:MM format using a 24-hour clock. Note that the time range is a sub-filter within each day of the report. For example, a date range of 10/22/98 to 10/23/98 and a time range of 10:00 to 11:00 will produce a report for the 10-11am hour for both 10/22/98 and 10/23/98 (not a 25 hour report from 10/22/98 at 10:00 to 10/23/98 at 11:00!). It’s important to note that when running a report where the time is NOT the full day (00:00 to 23:59), you can only report on the raw data (Summary None) because none of the rolled-up data contains information per hour. See Summary By section below. |
| Plotting Elements and Groups: The Matrix Report | Top |
|
There is a third way to look at CROME data, and this is known as the “Matrix” report:
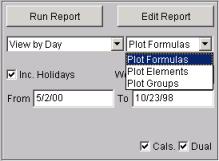
Whenever you view by “time” (i.e., Half Hour, Fifteen Minutes, Hour, Day, Week, Month or Year), you have three “plotting choices”: Plot Formulas, Plot Elements, or Plot Groups. Plotting Formulas is the default, and it simply means that for each time interval you want to see the values of the specified formulas (for example, “show me the Minutes of Use for all EBTSs on this day” – “Minutes of Use” is an example of a formula). Plotting Elements means: show me the value of each network element for each formula (for example: separate each EBTS, showing me it’s Minutes of Use for each day separately). Plotting Groups is similar to Plotting Elements, except you can look at pre-defined Groups of element (e.g., a Cluster of EBTSs) together. This will be come more clear when you view the upcoming examples in this document. Table of “View By” Choices and their meanings:
* The option "View By Sliding Hour" allows full ad-hoc
"busy hour on the fly" on
any formula in any report, this is essentially a matrix report with user
selectable (and a default) slice that will properly summarize the data and
display it as a sliding busy hour. For more details on this feature refer to
"Busy Hour on the Fly" |
|
Summary By |
Top |
|
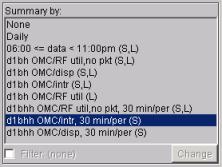
The CROME server performs a great amount of pre-processing on the performance data before it is available to the CROME software. This pre-processing, or “roll-up”, is done to improve performance: it drastically increases the speed of the database queries. The CROME server can be configured to roll-up the data in many different ways, and the possible roll-up choices are determined by the server configuration. The “Summary By” window shows the available roll-ups. The first choice, “None” represents a query to the raw, un-summed data collected by the system. It is necessary to query by “None” if attempting to look at hourly data (or increments even finer than an hour), or if viewing by element when you want to see a time-span less than the entire day. This is because “None” is the only Summary where hourly data is available – all of the roll-ups are done on a daily basis to improve performance The left picture belows shows the “Summary by” choices for
a typical Nortel GSM OMCR deployment, and the right picture shows a typical
Motorola iDEN OMC deployment).
The rolled-up data is also (naturally) much smaller than the raw data. Most CROME servers are configured to store rolled-up data for a very long time, and raw data for a short amount of time because it is so large. Raw data is usually kept around on the order of a few months, whereas rolled-up data can be kept for years. The following Summary By choices may be available,
depending upon the system configuration: Table of “Summary By” Choices and their meanings:
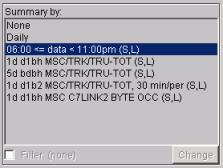
As there are restrictions (explained above) on Summary By choices as it relates to the View By choices, CROME will alert you with a red message at the bottom of the Main Screen if there is an illegal combination of Summary By and View By. In all cases, CROME will allow a report to be run if it is logically consistent and makes sense. A few typical invalid combinations and explanations follow: If you are doing a report in "View by Half Hour" or "View Hour" you must also select Summary None. Failure to do so will result in the following message:
If you select a branch (i.e. "Network Level") that is not compatible with your report (i.e.,. the raw data items which are used to satisfy the report's formulas). CROME will inform you of the condition and tell you at what "Network Level" the current report can be run at.
If you select a "busy period" from a branch that is not valid at or above the "Network Level" in which you selected, CROME will also inform you of the condition and tell you at what "Network Level" the current report can be run at.
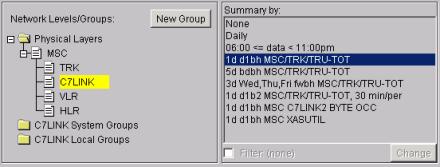
The above warning assumes a Nortel-MSC CROME system with a branch configuration for TRK and C7LINK support as follows:
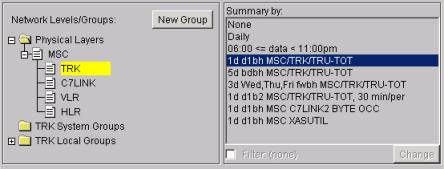
Changing the "Network Level" choice to TRK from C7LINK will allow the selected report to run, as it is now legal:
|
| Calendar Pickers | Top |
|
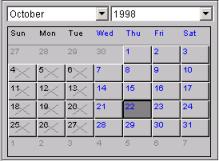
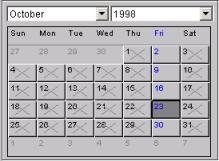
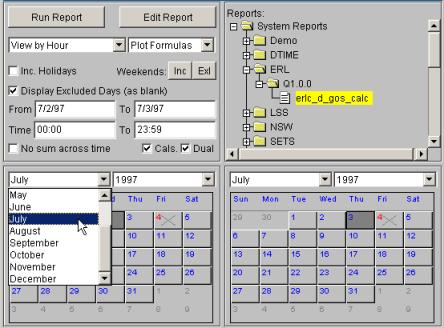
The “Calendars” provide a unique and highly effective way of selecting the “Beginning” and “Ending” Dates. The date range can be selected by clicking on the calendar buttons to select the day(s) or week(s) and by using the pull down’s to select the month and year. The “From/To” windows display the dates selected from the two “Calendars” displayed below.
By clicking on days in the left calendar, the “From” date will change to the desired date. Similarly, clicking on the right calendar will set the “To” date. All of the numbers on the Calendar Pickers are in blue except (1) black with an X if the day is an excluded day or (2) red if the day is a holiday (like July 4 in the example above) and Include Holidays is not checked. An “excluded” day can be a weekend (if you click Exl Weekends) or any day (by clicking on the appropriate day of the week – see below). Note that if you click on a day before the month starts (i.e., if you’re looking at a July calendar and you click on June 29 or 30 in the upper left corner of the calendar) then the calendar will jump to the previous month. Similarly, if you click on a day in the following month (in the above example, if you click on the greyed Aug 1 thru 9) the calendar will jump forward to August. You can also switch months and years via the pull-down menus, as shown in the above-left calendar. Also, when you choose View by Week, by Month or by Year (or when choosing View by Element and you pick the secondary choice “By Week” or “By Month”), the Calendar restricts the choices so that they fall on Week or Month boundaries, as necessary. (see the calendar example below, showing entire week highlighted because the user chose “View by Week”. Note that if you click on one of the days of the week (the blue-colored Sun, Mon, Tue, etc.) (see the left example below), that week will turn from blue to black, and X marks across each of the days, noting that you wish to exclude that day of the week from your query (see the right example):
As a convenience the Note that not all parts of the world use Saturday and
Sunday as their “weekends.” Through the
“Locale Properties” window from the main screen you can configure your weekends
to be different days of the week, thus changing the way
Note the “Cals” and “Dual” checkboxes, just above the left Calendar Picker:
By default these boxes are checked ON. If you uncheck “Dual”, then the Right Calendar Picker becomes hidden, expanding the space of the Reports section in the upper right corner of the main screen. When “Dual” mode is unchecked, then the single remaining Left Calendar Picker controls BOTH the From Date and the To Date. This is useful if you know you are only going to report on a single day, and not a span of days. Buy unchecking the Cals checkbox, BOTH Calendar Pickers become hidden, and the date must thus be entered manually into the From and To text boxes. Hiding both Calendar Pickers expands the space of the Report section in the upper right corner, and the Network Levels/Groups section in the lower right corner, making it easer to see all of the information in those two areas. Relative Dates in From/To Date fieldsNote that the From/To Date fields allow you to type in a “relative” date. For example, type in the word “yesterday” into the “from” or “to” date field and press the Tab key. The box will automatically change to reflect yesterday’s date. The following relative keywords are allowed: Xdaysago
(where X is a number) yesterday
(same as 1daysago) today (same as 0daysago) Xweeksago
(exactly X days ago) Xmonthsago
(exactly X months ago) Xyearsago
(exactly X years ago) Xstartweeksago
(0 is most recent Sunday, 1 is Sunday before that, etc.) Xstartmonthsago (0 is start of this month, 1 is
start of last month, etc.) Xstartyearsago
(0 is Jan. 1st this year, 1 is Jan. 1st last year, etc.) XSunago
(same as Xstartweeksago) XMonago
(0 is most recent Monday, 1 is
Monday before that, etc.) XTueago
(0 is most recent Tuesday, 1 is
Tuesday before that, etc.) XWedago
(0 is most recent Wednesday,1 is Wed. before that, etc.) XThuago
(0 is most recent Thursday, 1 is Thursday before that, etc.) XFriago
(0 is most recent Friday, 1 is
Friday before that, etc.) XSatago (0 is most recent Saturday, 1 is Saturday before that, etc.) |
| Reports | Top |
|
The upper right corner shows the available “Reports” organized into “Folders”. Crome has a concept of “System Reports” and “Local Reports”.
“System Reports” are defined as “Official” reports and reside on the remote CROME server. Normal users cannot make any changes to the “System Reports” or the CROME server's formulas, but they can run them from any PC or workstation that has access to the server. CROME takes great care in the management of “revisions” of these system reports, so that even if the corporation goes through several revisions of commonly used reports, the different versions can be managed within CROME to ensure that "apples to apples" comparisons can be made across years of statistical data.
“Local Reports” are created and maintained by the individual users. These reports reside on the user’s local disk, and can only be run or printed at the individual’s PC or workstation. Note, you can use the “System Reports” to quickly create your own reports, by simply saving them in the “Local Reports” folder.
Note that the top left corner of the CROME main screen shows two buttons: “Run Report” and “Edit Report”. The “Edit Report” button will change to read “New Report” if no report is selected in the Report list. So, if you click the button when it reads “Edit Report”, the Report Editor will come up pre-loaded with the selected report. If you click the button when it reads “New Report”, the Report Editor will come up with a blank report. To change the “Edit Report” button into the “New Report” button, simply click on the “System Report” or “Local Report” Folder. To put it back to “Edit Report”, click on an existing report in either folder.
We will review in detail Editing Reports and New Reports in a later section. |
| Network Levels | Top |
|
CROME requires that a Network Level be specified for every report that you run (note that’s every report you run, not define – the same report can and does run at different network levels). The available network levels are determined by the physical network topology of your wireless or wireline network. The example below shows a system where the OMCR is the top network level and where BSCs are allocated to OMCRs, BTSs are allocated the BSCs, and finally Sectors are allocated to BTSs. The raw data pegs that make up a report are usually database columns for tables applicable to the lowest level (e.g., Sectors), and thus a report can be run for individual sectors, or summed up to BTSs, BSCs, or OMCRs. Sometimes there are database pegs that are only applicable to a layer which is not the lowest level (e.g., you can have database statistics for a BSC that have no meaning on the BTS and Sector levels). In these cases, CROME automatically determines whether or not a desired network level is legal for the given report, and produces an error if you attempt to run such a report at the wrong level. Note that the hierarchy is tree-based (not linear). I.e., you can have more than one network level underneath another network level. The example below shows an OMCR system with just one level on top of the other. But, for example, a CROME MSC system may have an MSC at the top level and both TRK and C7LINKs at the same level, directly underneath MSC. The Network Levels section on the main CROME screen always shows three folders: Physical Layers, Systems Groups, and Local Groups. The System Groups and Local Groups folders are relevant only to physical layer currently selected. Note that as you click on different physical layers the visible “System Groups” and “Local Groups” change. In the example below, shown for a Nortel OMCR system, notice how clicking on Physical Layer OMCR changes the two folders below it to “OMCR System Group” and “OMCR Local Group”, and subsequently how selecting BSC changes them to “BSC System Groups” and “BSC Local Groups”, etc.
By choosing a Physical Group for the running of the report, you are instructing CROME to include all network elements at this level on the report (e.g., if you choose Physical Layer OMCR, the report will be for all OMCRs that were on-line during the date range of your query). Network levels will reflect both your System type (i.e. they will be different than the above four levels in a Nortel OMCR system) and also the actual organization of your data. More Physical Group representations for the iDEN OMC (top left), iDEN DAP (bottom left), iDEN MDG (bottom right) and the Nortel MSC family (top right) are shown below:
The CROME client is generic, able to accommodate many different system types and also able to grow with changes to your system infrastructure. For example, the top left image (iDEN OMC) have been expanded to include all tables at a given network hierarchy once it is added by Motorola, examples of this are CHAN, PCCH, CARR, MTL and GPROC statistics. Once this data was defined and made available by Motorola it was easily introduced into to the CROME system, thus becoming visible in the CROME client. |
| Example Data Organization under a Network Level | Top |
|
Now the concept of "Network Levels" and "System Views" have been introduced it is time to discuss a little bit about the actual data imported and managed by CROME, thus the data that is available to the CROME client. For every network level in a system view there exists one or more tables containing statistical data for example in our iDEN OMC system view (top left) the following tables (top right) are managed:
Custom GroupsThe System Groups and Local Groups represent groups of elements at a given physical layer. “System Groups” are predetermined Network reporting areas that your System Administrator has configured. As an example: if your market is broken down in work areas, North, South, East, and West, only the associated BTSs and Sectors for each work area will be included in those individual Groups. The Administrator might also group all the BSC associated with a single OMCR together as one reporting unit. The “System Groups” are available to all authorized users as they are stored on the Corporate Server. Local Groups are created and maintained on the user’s individual workstations. If you are responsible for 20 BTS, you can set up a group for just your cells and sectors. We’ll explain in detail in a later chapter how to create your own “Local Groups” using the “New Group” button. If a System or Local Group is selected before running a report, you will only report on the selected network elements in that group. |
| Contents | 1 | 2 | 3 | 4 | 5 | 6 | 7 | 8 | 9 | 10 | 11 | 12 | 13 | 14 | 15 | 16 | 17 | 18 | 19 | 20 | 21 | 22 | Previous | Next |
| Copyright © 1997-2005 Quantum Systems Integrators | Last modified: 30 Jun 2005 00:19 Authored by qmanual |