| Contents | 1 | 2 | 3 | 4 | 5 | 6 | 7 | 8 | 9 | 10 | 11 | 12 | 13 | 14 | 15 | 16 | 17 | 18 | 19 | 20 | 21 | 22 | Previous | Next |
| 17. Creating Local Network Groups |
|
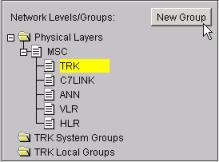
Access the Network Level. Select the Physical Layer where groups have been established either the Physical Layer or the System Layer. Select the lowest level of Elements that you want displayed in your New Group. For example if you want to do a group based on the sectors in certain cells you will select the sector level, or if you with to report upon specific top level MSC switches select that level.
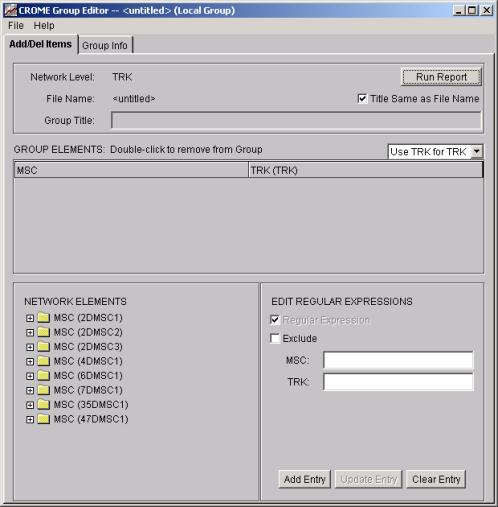
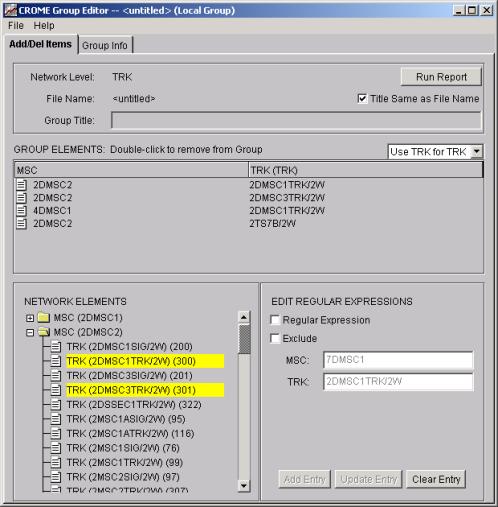
Once you have selected the Network Level to edit, select the New Group button, note you must select a valid data for which there exists data or your group choices will be empty. In the window below is the Group Editor in which to build your New Group. Select the “Add/Del Items” tab at this time.
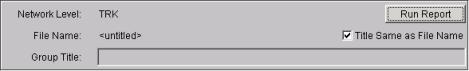
Check the box "Title Same as File Name" if the Group title is to be named the same as the file. If the title or name of the group is to be different than the file name uncheck the box, “Title Same as File Name". Inexperienced users should always check the “Title Same as File Name” to force the title and file name to be the same to avoid possible confusion.
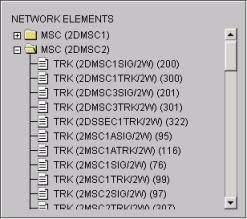
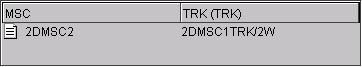
Group Elements: MSC, TRK – go to the bottom of the window and open any of the folders under “Network Elements” each folder represents a top level element or switch, the sub-items in these folders show children elements down to the level you started the group editor at. For example the folder showing “MSC (2DMSC2)” is shown open below:
Located in this folder will be all the TRK network elements associated with this MSC switch. Select a few TRKs from the Network Elements sub-window (from one or more top level switches or folders). The selected items are displayed in the Group Elements window. If you want all of the items you can do a regular expression (.*) in this field. Select the “Add Entry” button to update The example above shows the Group Editor launched at the TRK level. The display allows the user to select the elements they want represented in this group. The user can navigate the Network Element Tree and pick the desired elements or define regular expressions. Once a network element item is selected (from the “NETWORK ELEMENTS” sub-panel at the bottom) the item will be added to the middle section of the screen e.g. the “GROUP ELEMENTS” sub-panel this represents the active item in the group. Note, by double clicking on an active item it can be removed. |
| Static Grouping (i.e. sets of specific elements) | Top |
|
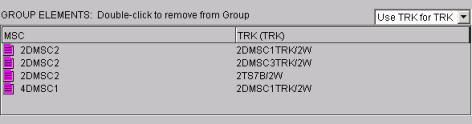
The following screen shows a simple set of statically selected elements similar to what you might construct.
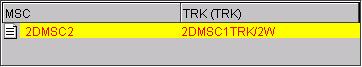
Note selected items above are denoted by a white "item", if in the future the network element is decommissioned, migrates to another top level network element, or has a name change the "item" will be displayed as pink to denote a stale selection for a given date. Assuming we saved the above Group and then set our period of interest to before CROME was installed, if we edited our test group all the elements would be stale as shown below (the items are pink):
The problems that can exist when statically creating groups due to adding new network elements, decommissioning old network elements, migrating sites, or renaming network elements lead to the creation of regular expression based group's. |
| RE Grouping (i.e. regular expressions) | Top |
|
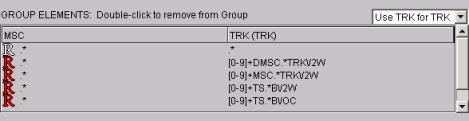
The following screen shows a complex regular expression (or RE) group defined as an inclusion of everything the white "R" symbol that excludes several other REs as denoted by the red "R" symbol:
It should be noted that RE based grouping doesn’t suffer from the "stale" condition and if a wireless or wireline operator follows a rigid naming standard. A RE group will always be valid. For example if the RE was "^NY*" (for New York) any items created in the future with that pattern will automatically be included in future reports. RE based grouping is accomplished by entering regular expression (or RE) syntax in the “EDIT REGULAR EXPRESIONS” sub-panel for each of the active network levels in the instance of your group editor and using the “Add Entry” or “Update Entry” buttons to place the RE in the “GROUP ELEMENTS” sub-panel.
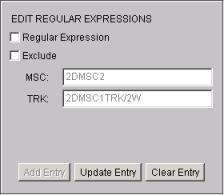
For example assume you have one static item you wish to create a RE from.
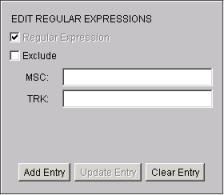
Select the item (single click) the item it will pre-fill the RE (below left)
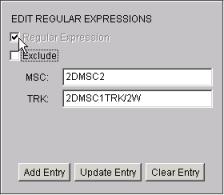
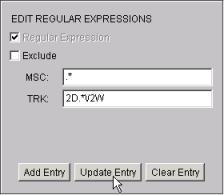
Checking the “Regular Expression” check box will convert the pre-filled information into a RE template.
Once it is set to a RE then the template can be modified to suit your needs, the below example will match all MSCs but only those trunk groups that start with “2D” and end in “/2W” (note the RE to match / is \/) will be selected when a report is run with this group.
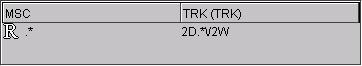
The final updated entry in the “GROUP ELEMENTS” sub-panel. is shown below:
The syntax is based on standard UNIX regular expressions, ore particularly the GNU C gnu.regexp library with one enhancement a range expansion operator [[<min#>-<max#>]]. Regular expression discriptions may be found on a Unix system via the following Unix man pages (either via the command line or via the Solaris answerbook viewer): · regex(1F) · regcmp(3C) · regex(5) · regcomp(3C): · egrep(1) · regcmp(1) In addition a detailed description of the actual package used is described in the section “CROME Regular Expression Primer”, and the “range expansion operator” is described in the subsection “CROME Extended Syntax” in this document. The use of the enhanced range operator i.e. a pattern encased in double brackets like [[0-200]] will resolve to patterns that match strings from as a numeric range (i.e. 000, 001, 002 .. 199, 200). |
| Grouping Legends and Color Codes | Top |
|
The symbols used by CROME in the group editor are as follows:
|
| Group Info | Top |
|
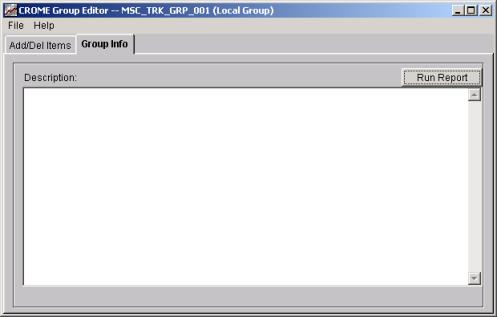
Select the “Group Info” tab In the window below add any description, or information relating to this new group that you wish to note for future reference.
|
| Saving a Group | Top |
|
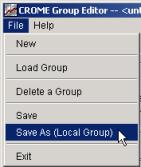
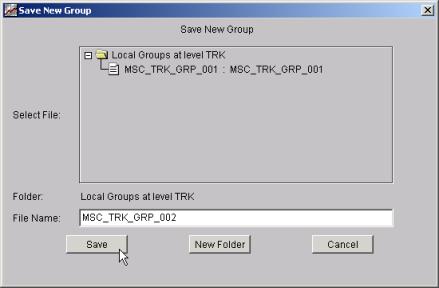
You have completed the “Add/Del Items” tab. The final step is to save this new group.
Select File. In this window you have the option: New: to build a “New Group” Load Group: Closes the current report you have on view, prompts you to save the current report, if it has not been saved, before showing you the available selection of reports in both the “System” and “Local” report folders. Load Group also takes the file and loads it from the editor onto your disk. Save: If you were editing an existing group and want to save the changes with the same name. Save As: Save the group you just created with a new name. Note: You will only be able to “Save” changes in the “Local” folder. You now have the option to create a new folder in which to file this group. The editor will display the path for the new folder above the “File Name” if you decide to make a new folder. In the example below we did not create a new folder. Click on “Save” and the window will exit back to the “Main” screen.
|
| Selecting a different Group for editing in the Group editor | Top |
|
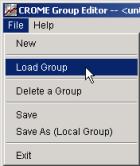
From the main “File” menu select “File/Load Group”
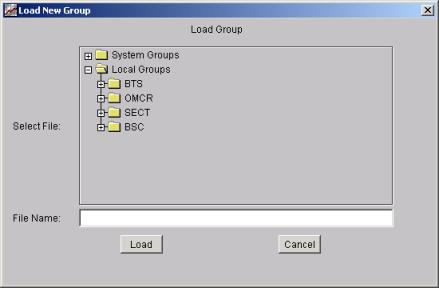
In the display below is the “Load Group” window. Open the folder where you saved your “New Group” Open the folder and select your group Double Click on the “Load” button, and your new group is now loaded. Note: the group does not have to be loaded for your reports to run against
|
| Geographic Grouping by Selecting Items on a Map | Top |
|
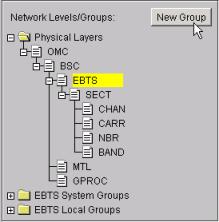
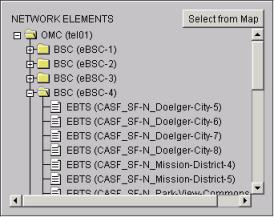
Network elements that can be geographically identified can be grouped based on their location on a map. For the following section we will use an iDEN dataset with a network hierarchy as follows:
Te resulting group editor launched after hitting the “New Group” button will have a new tab “Polygons”.
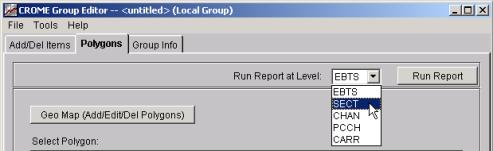
Please note since the EBTS level (e.,g. sites in iDEN) have geo-coded LAT/LON locations they can be reported on geographically via polygonal inclusion or exclusion, further more any EBTS level geographic group can be applied to any lower levels e.g. SECT, CHAN, CARR, NBR, or BAND. For this reason geographic groups at levels under the EBTS (or site level) would be redundant and are not allowed since the EBTS polygons can be run at the EBTS level (or any level below). The “Run Rep[ort at Level” drop down in the Group Editor controls what network level of items will be selected when this group is applied to a report.
A similar control will appear on the bottom of the CROME main screen when applying system groups or saved local groups, refer to the section “Running Groups at Lower Levels”.
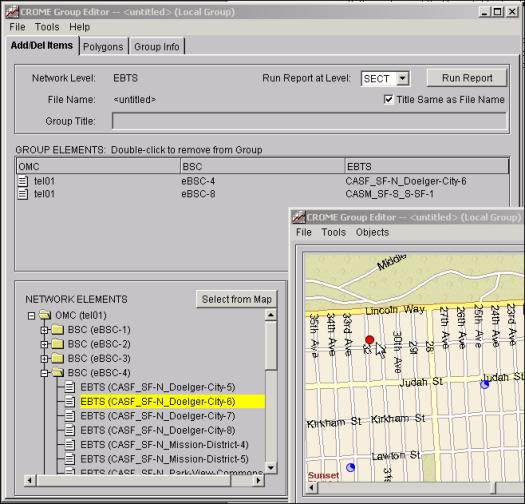
When launching the Group Editor at a “geographic” level, an additional button appears in the lower left section of the window that says “Select from Map”
When this button is selected, a CROME Geo Map will appear. This Geo Map Window is “associated” with this instance of the Group Editor (such that when you quit this Group Editor window, the Geo Map will disappear as well). On the Geo Map, simply click on the site you want to include in the group. Once clicked, the site will turn red and the site name will highlight in the Group Editor window, and appear in the top “GROUP ELEMENTS” area, as if you had clicked on it:
Clicking on the site again will remove it from the group. |
| Geographic Grouping by Drawing Polygons | Top |
|
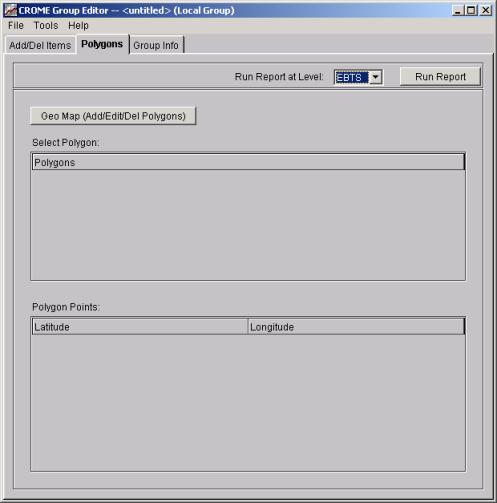
And even more powerful method of Geographic Grouping than the site selection method shown above, is Polygon Grouping. In Polygon Grouping, you can create a geographic group specified by a geographic boundary. This is an extremely easy mechanism to “assign” geographic areas of responsibilities to engineers by create polygon-based groups. When launching the Group Editor at a “geographic” level, an additional tab appears called “Polygons”. If you click on that tab, you’ll see a page like:
This page shows all polygons for this report. To add a polygon, click on the “Geo Map Add/Edit/Del Polygons) button. This will launch the Geo Map. The bottom left corner of the Geo Map control window shows a section called “Polygons in this group, along with four buttons: New, Save, Cancel, and Undo:
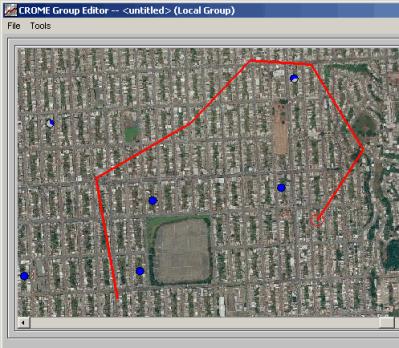
“New” starts the creation of a new polygon and allows you to click on the map and draw a polygon. Simply click in different locations and you’ll see lines begin to form for the polygon:
“Undo” will undo your previous point selection, and “Cancel” will stop the polygon drawing process and clear the polygon lines from the screen. “Save” takes the points you’ve selected, closes the polygon, and adds this polygon to the group.
You’ll notice that once saved, the polygon changes from red to yellow and becomes “filled”. By default, the polygon is filled with a 50% shading. Polygon shading can be modified by a control on the GeoMap:
Once the polygon is saved, it also appears in the Group Editor:
Note that the top section of the Polygon Name (which by default is Polygon01 for the first polygon drawn for this group, but can be changed – see below), and the bottom section shows the actual latitude and longitude points of the polygon. Back on the Geo Map display, you can edit this polygon’s name and points by clicking the right mouse button over the polygon and choosing Edit This Polygon:
Note as shown in the picture this is also how you can delete the polygon from the Group. When choosing Edit, you can modify the name of the polygon or its points directly:
Note that you can copy from or paste to this window, making it easy to take existing polygons from other applications and copy/pasting them into this window to create polygons of known latitude/longitude points. IMPORTANT: Once you’ve selected the Save button for the polygon, and the polygon is thus added to the group, this does NOT mean that the group itself is saved. You still need to Save the group file to disk to save the polygons in this group. Now that this group has a polygon associated with it, if you click the Run Report button you will see that only sites in this polygon are included in the report. Note that all polygons and all items selected on the Add/Del Items screened are unioned together to determined the final set of elements in the report. I.e., the resulting group will include all items selected on the Add/Del Items screen, plus any items that fall within any of the polygons in the group (of course, sites that exist in more than one polygon, or that exist both in the Add/Del Items screen and in one or more polygon, will still be treated as one site in the report). Something else to note about the Geo Map window when used for drawing polygons, and that is the section that is titled Show Other Group Polygons. This shows all other System and Local Groups at this level and allows you to select any number of them. Any selected group that has one or more polygon defined will have its polygon(s) appear on the map in green: These other polygons can be used as reference when creating new polygons. To further make it easy to create non-overlapping polygons (for example to define engineer’s assigned geographic areas), the Geo Map contains a checkbox titled “Snap to Other Polygon Points”. When this checkbox is on, then when drawing polygons (as defined above) points will “snap” to nearby polygon points of existing polygons. This makes it extremely easy to create adjacent polygons that do not overlap and that do not have gaps between them. |
| Contents | 1 | 2 | 3 | 4 | 5 | 6 | 7 | 8 | 9 | 10 | 11 | 12 | 13 | 14 | 15 | 16 | 17 | 18 | 19 | 20 | 21 | 22 | Previous | Next |
| Copyright © 1997-2005 Quantum Systems Integrators | Last modified: 30 Jun 2005 00:19 Authored by qmanual |