| Contents | 1 | 2 | 3 | 4 | 5 | 6 | 7 | 8 | 9 | 10 | 11 | 12 | 13 | 14 | 15 | 16 | 17 | 18 | 19 | 20 | 21 | 22 | Previous | Next |
| 16. Creating a New Formula |
|
Bring up the Report Editor, by clicking on the “Edit Report” button, on the Main Screen and selecting a report from the System or Local folder.
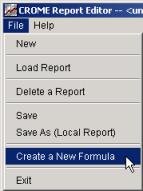
Select “File/Create a New Formula”.
|
| Formula Info | Top |
|
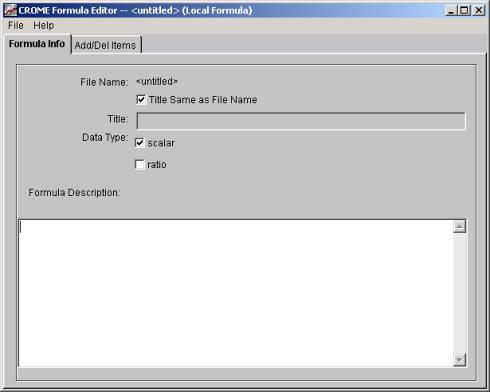
The Blank Report Editor will appear on your screen, displaying the Formula Info window below:
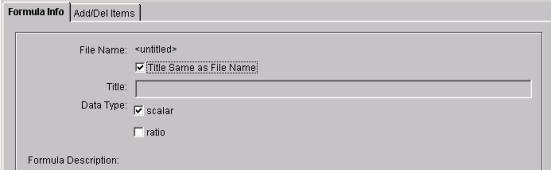
File Name: The window below illustrates change of Title Name. If the “Title Same as File Name” box is not checked the file name can be different from the title. The operation of this field is identical to that of the Report Editor. Inexperienced users should always check the “Title Same as File Name” to force the title and file name to be the same to avoid possible confusion.
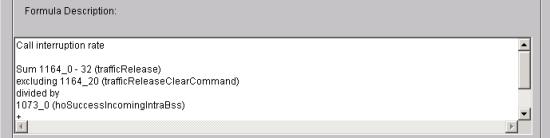
Data type: This check box lets the user pick between a Scalar (a summed or provisioned count) or Ratio (a percentage). Setting this correctly is probably the most important aspect of a formula to ensure proper display and axis binding. Formula Description: Is an area to make arbitrary user notes on the description of the formula, or other comments for reference.
|
| Add/Del/Items | Top |
|
This is a familiar window (e.g. similar to the Report Editor) with some new features to support formula creation. Like the Report Editor, this portion of the Formula Editor is broken up into two regions. The top portion of the screen holds the actual formula as created from a palette of choices from the bottom portion of the screen. Formulas can consist of raw pegs, other formulas, functions, constants, operators and grouping symbols. Let’s move our focus to the lower part of the Formula Editor window to review the familiar features, and explore new ones.
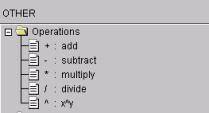
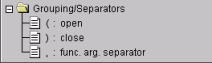
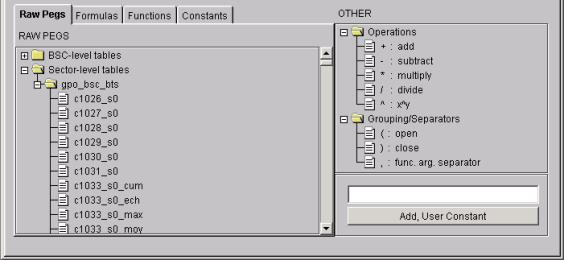
We’ve used the Raw Pegs in the Report Editor, but only as a single counter entry. In the Formula Editor you can make mathematical formulas and equations with the counters. In the window below are the open folders for Operations and Grouping/Separators
|
| Functions | Top |
|
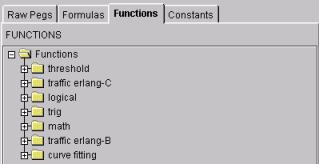
The Functions Folder contains different function sets that allow the creation of formulas.
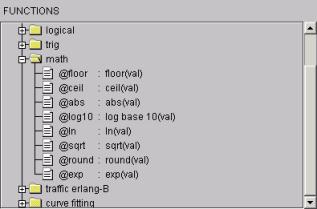
Math FunctionsContains the different Math functions that may be used in developing formulas.
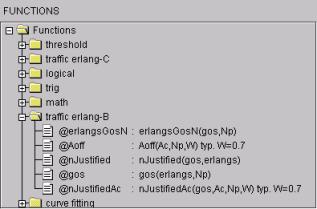
Traffic Erlang-B and Erlang-C FunctionsThese are functions that relate to Traffic Engineering. Erlang-B functions available: gos (Grade of Service) has two arguments: Ao stands for Carried traffic or Offered traffic, which is traffic in Erlangs. Carried traffic is the traffic measured on the Network. Offered traffic is the traffic, if 100% of the calls are serviced. The Np argument is the number of trunks, channels or servers. The nJusttified (N-justified) formula will give you the N-justified value given the Grade of Service and the Erlangs. The Grade of Service and the Erlangs are the 2 arguments to the N-justified. A more detailed explanation of traffic functions are included as an Appendix.
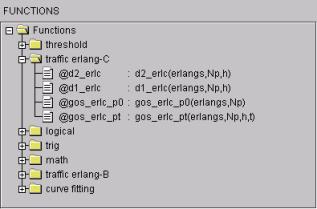
Erlang-C functions available: d1_erlc (average delay of all calls), d2_erlc (average delay of delayed calls), gos_erlc_p0 (probability of delay), and gos_erlc_pt (probability of delay greater than the supplied time). A more detailed explanation of traffic functions are included as an Appendix.
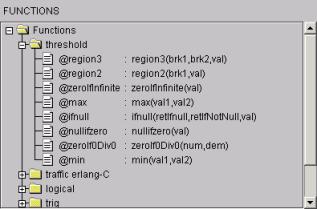
Threshold FunctionsThe Threshold folder contains functions that relate to Traffic Engineering and particularly to Threshold values. This folder contains 3 formulas: @region3, @region2 and @zeroIfDiv0.
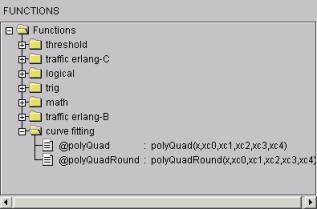
Creating boolean proxies and logical formulas @region2() and @region3()WPM2 enables the generation of a Boolean proxy typical used to create AND/OR conditions via a new numeric column. This is accomplished via the use of a @region3 or @region2 function. The @region3(brk1,brk2,val) has 3 arguments and they will return 3 break values 0,1,2. You could use this to specify break values equivalent to heavy, medium, and light. The @region2(brk1,val) has 2 arguments and will return 2 break values and they will be 0 and 1. You could use this to specify break values equivalent to heavy or light. For example suppose we make an “proxy” equation called “drop_violation” (i.e. when a drop_percentage exceeds 1%) based on the Threshold Function as follows: @region2(0.01,drop_percentage) # formula drop_violation We can then directly sort and/or apply pre-defined reporting thresholds to the resulting reports and easily get a listing of all items in which we have a drop_violation (i.e. when percentage > 1%). This concept can be extended with another “proxy” equation (which also returns zero or one) by making yet a third formula that either multiplies or adds two such “proxy” equations we have preformed a logical AND or a logical OR respectively. For example our second “proxy” is called “major_trunk” (i.e. when the number of DS0’s in a TRK group is over 80). @region2(0.01,drop_percentage) # formula major_trunk Know we want to logically AND the two proxies “major_trunk” and “drop_violation” to get only those drop violations that occur on major trunks. To do this we define a new formula “major_drop_violation” as follows: drop_violation * major_trunk # formula major_drop_violation At this point we can run any report that contains the formula item “major_drop_violation” and if it has a value of one (1) and not zero (0) we have satisfied our AND condition. We will typically do a sort by major_drop_violation descending from the “Sort” menu (refer to the section titled Tools, Filtering, Sort) or via a Threshold to basically pre-sort the results and suppress those items that resolve to a zero (0) which logically do not satisfy our condition. @zeroIfDiv0In certain cases the user does not want to explicietly see division by zero errors, if this is the case the formula (or equation of raw pegs) in question can be wrapped with this function. An example follows in which we are defining the ratio formula “call_success_percent” but the peg “attempts” might be zero. successes / attempts # formula call_success_percent If attempts is zero the resulting value of call_success_percent will be defined as zero percent or 0.00% as oposed to the distracting value of #DIV/0! @max() and @min()Please note the functions max(arg1,arg2) and min(arg1,arg2) are not aggregate functions across the query as you would expect in a SQL statement[3]. These functions are simply a method of selecting the best data from two query buckets (or formulas) and returning it as one query bucket or formula. For example assume we have an iDEN system and that CROME proactively audits all base radios (BR) proactively for "forward power" in the field via an SNMP query and stores the returned values into a database table in a peg called "wbr_cnt" representing the working BR count for a given sector. In addition the SNMP queries used may sometimes fail but you have a good fallback method of determining the BR count via a statistical formula. The fallback formula basically adds up time used and time idle via a statistical metrics available from other sources, this formula is called "cbr_cnt". However this fall back method sometimes reports too few radios due to either mathematical issues or minor "slop" in what reporting period the data appears. In fact this method is always a bit less than the real whole integer BR count it tries to approximate. Use of max and round functions in the following context: @max(wbr_cnt,@round(cbr_cnt)) would choose the best metric for our radio count. Now another issue might come to play suppose that the formula "cbr_cnt" can fall prey to division by zero errors and return positive infinity (reported and carried through the CROME evaluation engine as #DIV/0! ) you might want to suppers such an propagated error via the function zeroIfInfinite(). Thus our improved and final "best" choice formula becomes: @max(wbr_cnt, @zeroIfInfinite (@round(cbr_cnt))) As captured in a CROME formula editor (note, BR_Count_per_Cell is @round(cbr_cnt) with internal @zeroIfInfinite protection) this would be as follows: @max ( omc_db:cell_prov:wbr_cnt , System Formula SETS/V7.0.1c/RF_Utilization/BR_Count_per_Cell ) The above formula will typically return the number of BRs that have forward power (i.e. audited and stored in the table "cell_prov:wbr_cnt") first then in rare cases fallback to any legal (i.e. non-infinite return value) result from the BR count which is approximated by the formula "cbr_cnt". This entire discussion has in fact has been done in the Quantum supplied iDEN formula set known as "SETS version 7.0.1c and formulas BR_Count_Per_Cell_QSI". @zeroIfInfinate()In certain cases you might want to avoid propagating an INFINITE number, typically reported as a #DIV/0! In the result set of CROME. An example might be a formula or sub-term of a formula like the term (1/pcch_interleave), obviously if pcch_interleave is zero (i.e. 0) for any reason we would have an infinite number. The following would simply return zero in the INFINATE case, else return the correct value as expected: @zeroIfInfinite ( 1 / omc_db:chan_statistics:pcch_interleave ) The enhanced formula System Formula SETS/V7.0.1c/RF_Utilization/BR_Count_per_Cell in the Motorola iDEN view actually uses this technique to avoid erroneous results. @ifnull()In certain cases you might want to avoid propagating an NULL number, typically reported as an empty string or you might want to conditional switch raw pegs based upon an occurrence of a null value. This function takes three arguments @ifnull(retIfNull, retIfNotNull, value) and will return arg#1 if the test value (arg #3) is null or arg #2 if the test value is non-null. @nullifzero()In certain cases you might want to force propagating an NULL number, typically reported as an empty string. This function takes one argument @nullifzero(value) and will return null if the test value (arg #1) is exactly equal to zero, else it will return the test value. Curve Fitting and ApproximationContains the different functions that may be used in approximation or curve fitting.
The following is a complex example of using @polyQuadRound(), br_2_vc_srvs , this formula models the number of Voice Servers from active base radios count (e.g. those base radios with forward power) in an iDEN network given the number of base radios. VC = (c0 + c1*BR^1+ c2*BR^2 + c3*BR^3) c0= -0.0948616600793657 c1= 5.306703847893932 c2= 0.05195795813643106 c3= -0.0012366225180865382 c4= 0.0
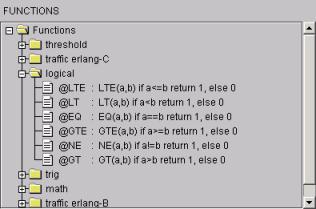
Note c4*active_br_cnt^4 term was not needed to model the above table (thus it is set to 0.0). The equation could continue beyond the example table to high BR values in the CROME reporting system at EBTS/BSC and even OMC summations. However due to dominance of highest order term in the polynomial at values > 20 BRs a linear function @round(active_active_br_cnt*117/20) is utilized. @round ( @region2 ( 20 , System Formula ERL/Q1.0.0/active_br_cnt ) * System Formula ERL/Q1.0.0/active_br_cnt * 117 / 20 ) + @region2 ( 0 - 21 , 0 - System Formula ERL/Q1.0.0/active_br_cnt ) * @polyQuadRound ( System Formula ERL/Q1.0.0/active_br_cnt , 0 - 0.0948616600793657 , 5.306703847893932 , 0.05195795813643106 , 0 - 0.0012366225180865382 , 0 ) Logical FunctionsContains the different boolean functions that return 0 for false or 1 for true that may be used in developing formulas.
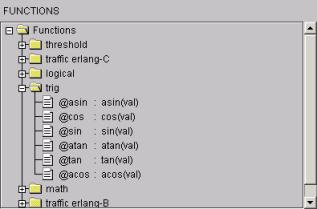
@LTE(a,b) returns 1 (or true) if a is less than or equal to b, else 0 (or false) @LT (a,b) returns 1 (or true) if a is less than b, else 0 (or false) @EQ(a,b) returns 1 (or true) if a is equal to b, else 0 (or false) @GTE(a,b) returns 1 (or true) if a is greater than or equal to b, else 0 (or false) @NE(a,b) returns 1 (or true) if a is not equal to b, else 0 (or false) @GT(a,b) returns 1 (or true) if a is greater than b, else 0 (or false) Trig FunctionsContains the different Math functions that may be used in developing formulas. Typically these functions have no benefit to performance reporting (PM) and are used for regression testing.
|
| Constants | Top |
|
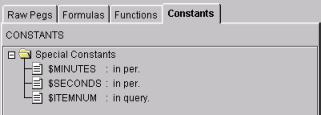
These special Constants will help you in the development of your formula. The $MINUTES will convert the given value to minutes. The $SECONDS will convert the given value to seconds. These two constants are critical if you want to construct functions such as Erlang densities for periods other than an hour.
The final constant, $ITEMNUM will give you the total count of the items return under a multi range query (i.e. “view by day” across multiple days), in general this is statistically useless and is used only for presentation of contrived examples. The key point to remember is that if you can craft an equation or formula which gives Erlangs for an hour period e.g. I3_ERL = CCS /
36 then you should always normalize it via a time constant as follows: I3_ERL = ( CCS
/ 36) / ( $SECONDS / 3600 ) Developing equations (particular Erlang densities as shown above allows the same report to perform grade of service analysis at period as small as the finest reporting period in the system type being analyzed ranging from 15 minutes to a whole day (although typically you would limit the period to a few hours). The key point is CROME is not constrained to just a busy hour you can look into smaller periods of time to find higher peaks and potential area of tuning and improvement. |
| Raw Pegs and Formula Legends | Top |
|
The symbols used by CROME in the report editor and formula editor are as follows:
|
| Creating a New Formula | Top |
|
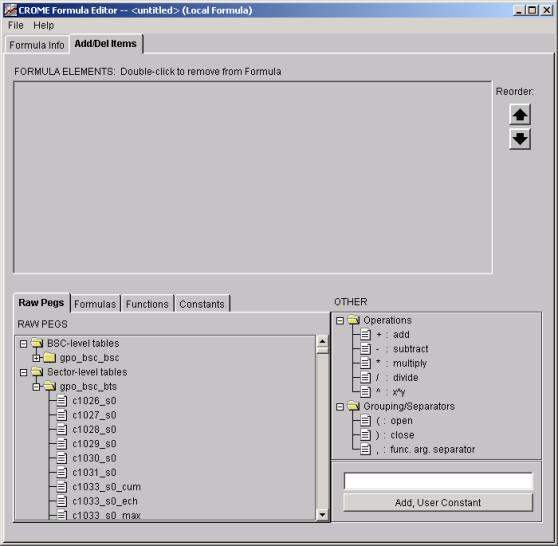
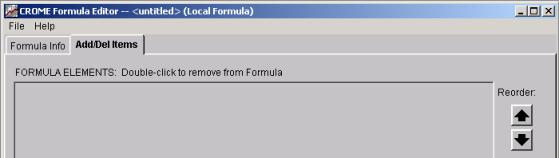
In the window below is the Add/Del items screen, this is where we are going to make a new formula. The top area or Formula Elements will be populated as you select the pegs or use established formulas to build the new formula. Use the Reorder Arrows on the right side to move the elements of the formula up and down.
In the Raw Pegs/Formula area you will select either the Raw Peg or an existing Formula (located in Formulas) to use. You can build the new formula using the Operations (for simple mathematics) or use the Functions and /or Constants that we reviewed above. Moving around in the Raw Pegs, Formulas, Functions and Constants is easy, select the tab for the folder needed, select the item, use the Operation selections and Grouping/Separators. If you need to add a constant, use the open white area above the “Add, User Constant” button to type in the value required. If you change your mind, double click on the item in the Formula Elements screen (i.e top of the window) to remove the item, or use the arrows to move the items around into the correct position.
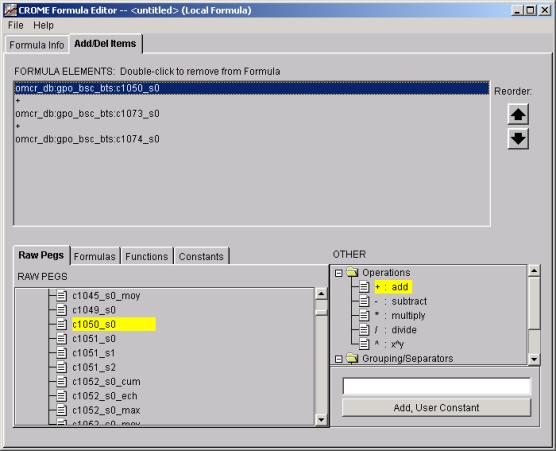
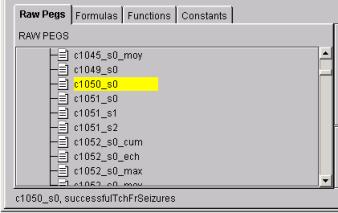
In the window below a simple formula called TchSeiz is created, using 3 of the raw pegs, remember to view the Q3 name that corresponds with the counter number by holding down the right mouse button on the counter number, and the (+) sign in the Operations Folder. Notice that the counter peg is highlighted and the plus (+) sign. f by accident I selected the wrong counter, I can easily double click and remove it and select another counter or reorder the pegs.
For some system types an alternate set of naming standards are possible in a global context via the properties settings, these names can be looked up if installed for a given system via a "right" click on a counter or peg. Below we show the lookup for peg c1050_s0 via a "right" mouse click, CROME will return the name "successfulTchSeizures" as the associated alternative name for peg c1056_s0 in the lower display area.
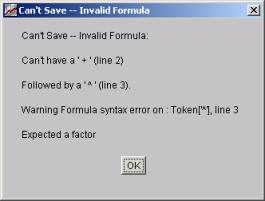
CROME will inform you with a message window pop-up as displayed below, if the formula does not evaluate to a legal mathematical expression (i.e. parse correctly) when you perform a Save or Save As.
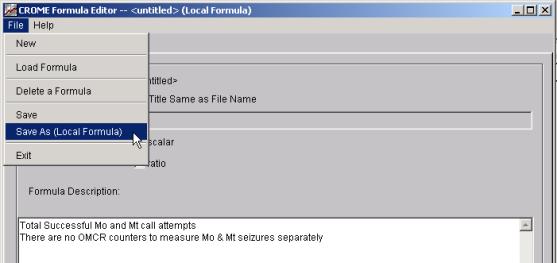
I’ve checked my formula and now I am ready to Save As. You will notice that I have filled in the description area and checked the Data Type is scalar. The Formula title will be set to the same name as the file name when defined upon selecting a "Save As" operation.
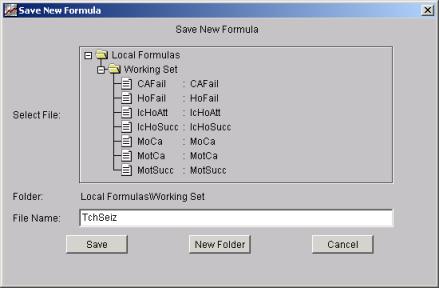
This is the Save New Formula window, I would like to save this new formula in the Local Formulas Folder, in my Basic 10 folder (you could create a New Folder in this window to file your new formula, see New Group to reference creating new folder). In the window below I named my new formula (TchSeiz). Click the Save button when ready. Save the new formula under the "Local Formulas/Basic 10" folder or create a new folder by clicking the "new Folder" button. Select an existing file (if you wish to overwrite) or enter a new file name.
Select the "Save" Button. This formula is now available to be used in the Report Editor and added to any report. |
| Contents | 1 | 2 | 3 | 4 | 5 | 6 | 7 | 8 | 9 | 10 | 11 | 12 | 13 | 14 | 15 | 16 | 17 | 18 | 19 | 20 | 21 | 22 | Previous | Next |
| Copyright © 1997-2005 Quantum Systems Integrators | Last modified: 30 Jun 2005 00:19 Authored by qmanual |