| Contents | 1 | 2 | 3 | 4 | 5 | 6 | 7 | 8 | 9 | 10 | 11 | 12 | 13 | 14 | 15 | 16 | 17 | 18 | 19 | 20 | 21 | 22 | Previous | Next |
| 12. Complex reporting tasks via “PLUGINs” |
|
The CROME client GUI is a generic reporting engine and as such there are some complex reporting tasks that can not be efficiently captured in a generic paradigm. To allow the creation of specialized reports or “point-tools”, CROME can execute “bean shell” scripts or JAVA programs, hereafter called “PLUGINs” that expose portions of the internal CROME Client API for use in the creation of full custom tasks including but not limited to: · Forecasting · Variance Reporting · Paging of technicians or generation of SMS messages of unique conditions The PLUGIN capability provide a simple yet powerful method
of extending the CROME client via allowing custom JAVA based programs to
manipulate the CROME result set. Note
“PLUGIN” development is beyond the scope of the average user and is typically
done by your system administrator
however Quantum’s support staff is available for these custom development
efforts. Please refer to supplementary
documentation on writing “PLUGINs”. |
| Sample “PLUGINs” | Top |
|
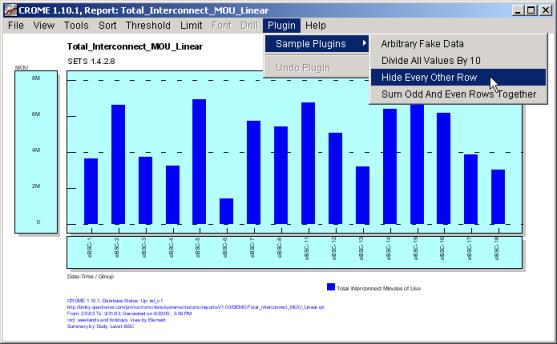
The CROME client is delivered with several sample “PLUGINs” that are always available for application to any report item these are basically toy samples to aid customer system administrators in developing there own PLUGIN solutions. Below is an example report with the menu “Sample PLUGINs” highlighted.
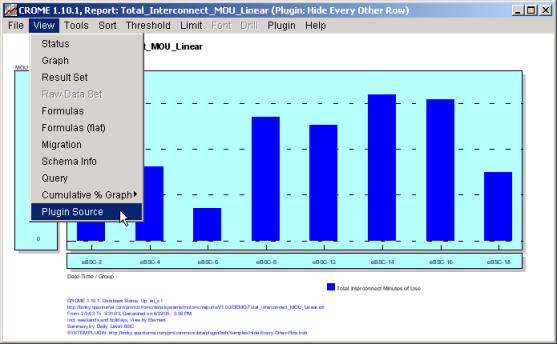
Below is the result after executing “PLUGINs/Sample PLUGINs/Hide Every Other Row”
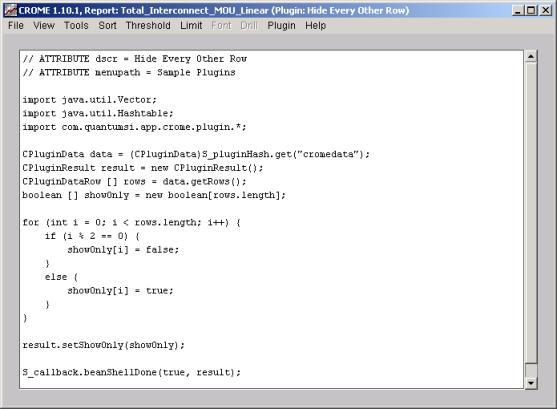
Below is the actual “PLUGIN” source that performed the “hide every other row” operation
|
| Forecasting via “PLUGINs” | Top |
|
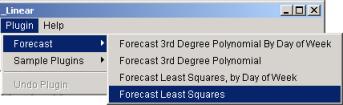
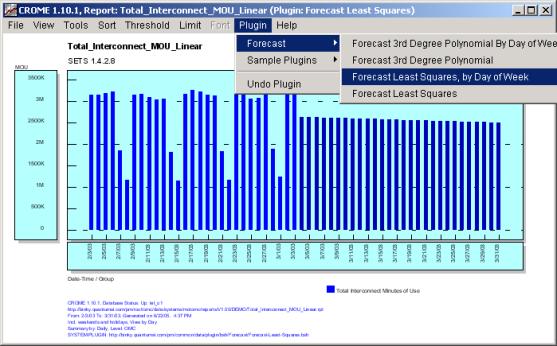
The CROME client is also delivered with several pre-configured production quality “PLUGINs” used for data forecasting. These “PLUGINs” only become active and available in the “:PLUGIN” menu for reports that are run in the appropriate fashion. Forecasting makes no sense for View By Element thus the menu items for forecasting are never displayed in this mode, however for reports like “view by hour”, “view by day” forecasting is a valid function and thus a “new” menu will appear.
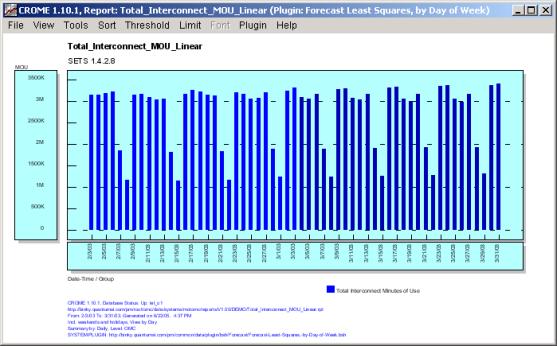
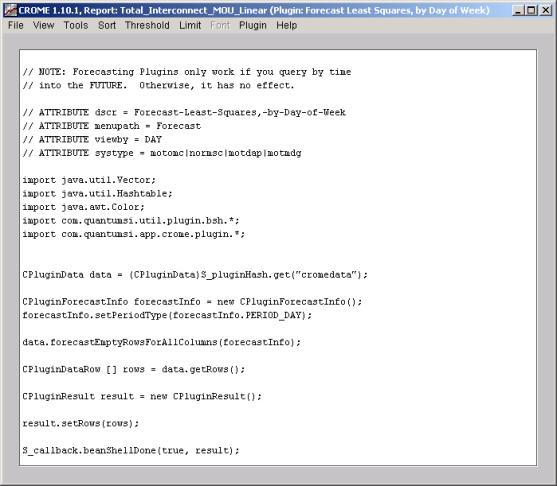
This menu enabling is controlled by the ATRIBUTE fields in the source of the various “PLUGINs”, in fact the availability of “PLUGINs” can be also triggered by the presence or absence of formulas or columns in a given report via other ATTRIBUTE tags. A “daily report” is shown below in which the above “Forecast Least Squares” PLUGIN was applied. Note the forecasted data is displayed in a different color
Of course since peak traffic levels differ by day of weeks, it would be better to use the “Forecast Least Squares By Day of Week” PLUGIN, this more accurately displays the data sets natural recurring trend.
The PLUGIN source via the “View/Plugin Source” menu, and also exported via the “File/Export/Plugin Source” menu.
The first two ATTRIBUTE tags build up the menu items for the upper menu bar’s “Plugins” menu and the second two ATTRIBUTE tags limit how (e.g. on what legal configurations) the PLUGIN is allowed to run under (or made visible to the user). |
| Custom Analysis via “PLUGINs” | Top |
|
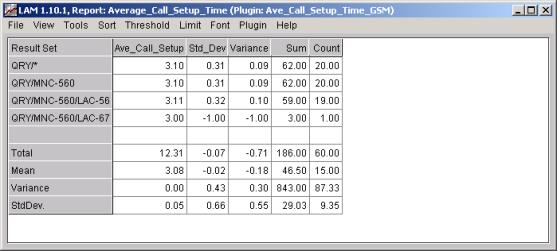
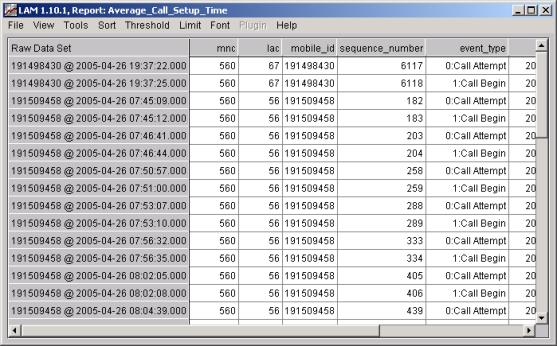
This example shows a CROME report with a bound “PLUGIN” which will always execute automatically when the report is run from the CROME main screen. This example is a report used to analyze a non-PM source, e.g. drive test data, and apply extensive post processing via a “PLUGIN” on the data that the generic portion of the CROME report originally mines.
The raw data used by the PLUGIN is shown below:
The source for this data analysis “PLUGIN”, e.g. “Ave_Call_Setup_Time”, consists of 297 lines of Java source including white space and comments. |
| Contents | 1 | 2 | 3 | 4 | 5 | 6 | 7 | 8 | 9 | 10 | 11 | 12 | 13 | 14 | 15 | 16 | 17 | 18 | 19 | 20 | 21 | 22 | Previous | Next |
| Copyright © 1997-2005 Quantum Systems Integrators | Last modified: 30 Jun 2005 00:19 Authored by qmanual |